Hi Merry Christmas and a Happy New Year!
Am travelling now and will try to write in a week's time as we conclude the year.
Tuesday, 25 December 2012
Sunday, 9 December 2012
Hi, welcome back. Since the equity market's reversal on 16 Nov 2012 when the intermarket analysis provided confirmation of a risk-on trade (as covered in my earlier posting), the equity market has since been on a rise.
Over the recent week, there has been a reversion to more caution as evidenced by price declines in gold, silver (which have become speculative in nature), commodities, oil and Australian dollars. This may just usher in a period of consolidation before the S&P500 were to begin a more decisive move - my bias is upwards.

See you in two weeks' time!
Sunday, 25 November 2012
Intermarket Analysis - Part 2
Hi everyone, in my last posting, we did an analysis on price movements across four financial markets - currencies, commodities, bonds and stocks. How they interact would give rise to their predictive value.
John Murphy, a pioneer in intermarket studies, made the following observations:
1. US dollar trends in opposite direction of commodities (as commodities are denominated in USD)
2. Commodities trend in opposite direction of bond prices (inflationary signal)
3. Commodities trend in same direction as interest rates (inflationary signal)
4. Falling rates are normally good for stocks (search for higher yields)
5. Bonds and stocks generally move in same direction (interest rate driven)
6. Bond market, however, normally changes direction ahead of stocks
7. A rising dollar is good for US stocks and bonds
If you study the charts I appended in my last few postings, you will notice there are some points of divergence worth highlighting here:
1. While commodities generally trend in opposite direction to the US dollar, it has not always been the case. An overriding factor is global growth outlook expectations which impact on demand for commodities. So while the US dollar may weaken given a weak domestic economy and aggressive monetary expansion, commodity prices did not rise much further especially if economies like China slow.
2. Current low interest rates did push up bond prices. But because there are little inflationary fears at the moment, commodities are not being bidded up.
3. Current low interest rates actually make equity investing more attractive because of the higher earnings yield and dividend payout from stocks, providing a good reason to participate in equity investing as institutional funds seek out higher yields.
4. Bonds and stocks are both on an uptrend since 2009. However, when looking at short-term swings, bonds and stocks have been moving in opposite directions. When stock prices are moving higher, bond prices would fall as interest rate rises, possibly to maintain some near-term yield parity across the two asset classes.
5. On the contrary, a stronger US dollar has not been that kind to the stock market. This could be due to the US dollar carry trade where US dollar was shorted by big players with the proceeds used to buy into US equities. When the US dollar rally, short-covering occurs and US equities had to be sold to raise funds to buy back the US dollar.
6. Bond prices are likely to lead in major stock market reversals so this will also be a key space to watch.
Meanwhile, the market has swung into a new up-leg, which may extend all the way till year-end. Notice how the asset classes continue to move in a similar fashion like they did during the previous up swings (see my earlier postings). Precious metals are trending strongly along with equities. (click or tab chart to enlarge)

Conclusion
Understanding inter-market analysis is key to improving our ability to forecast the markets. While classical economic and financial theories hold up well most times, for the shorter-term, it would be important to understand the prevailing sentiments driving the markets. For instance, expectations on growth outlook, deflationary concerns (rather than inflationary due to QE), flight to safety and anticipation of Fed's policy responses interact to drive funds flowing into different asset classes at different times. Armed with this knowledge, you will be able to respond appropriately to what the market is telling us and stay invested in the right trending assets. Remember, as the markets swing from one extreme to the next, these provide further trading opportunities once you realise their relationships and are ready to position to take advantage of each swing.
While stock picking can help beat market performance, an occasional wrong pick could decimate a portfolio's returns. Company specific risks such as unexpected changes in management, changes in industry regulations, accounting fraud, litigation suits and loss of some big customers could potentially crush stock prices. Hence, for market-timers (swing traders) who are apprehensive of stock picking strategies, they can consider swing trading using sector ETFs. Afterall, a large part of a stock's price movement is tied to the sector movements. Leveraged sector ETFs, while volatile, can be quite safe as sectors don't collapse to zero values like stocks could while giving investors/traders an extra boost to otherwise slower but more stable index movements. There are many choices of sector ETFs to choose from and one should be looking at their liquidity and structures to ensure they are not easily manipulated and their structures are not faulty to what they are intended to measure and capture. ETFs can likewise be used to capture gains from inter-market correlations and movements as institutional funds rotate causing the regular ebb and flow we have seen across different asset classes.
Thanks for visiting. See you in two weeks' time!
Hi everyone, in my last posting, we did an analysis on price movements across four financial markets - currencies, commodities, bonds and stocks. How they interact would give rise to their predictive value.
John Murphy, a pioneer in intermarket studies, made the following observations:
1. US dollar trends in opposite direction of commodities (as commodities are denominated in USD)
2. Commodities trend in opposite direction of bond prices (inflationary signal)
3. Commodities trend in same direction as interest rates (inflationary signal)
4. Falling rates are normally good for stocks (search for higher yields)
5. Bonds and stocks generally move in same direction (interest rate driven)
6. Bond market, however, normally changes direction ahead of stocks
7. A rising dollar is good for US stocks and bonds
If you study the charts I appended in my last few postings, you will notice there are some points of divergence worth highlighting here:
1. While commodities generally trend in opposite direction to the US dollar, it has not always been the case. An overriding factor is global growth outlook expectations which impact on demand for commodities. So while the US dollar may weaken given a weak domestic economy and aggressive monetary expansion, commodity prices did not rise much further especially if economies like China slow.
2. Current low interest rates did push up bond prices. But because there are little inflationary fears at the moment, commodities are not being bidded up.
3. Current low interest rates actually make equity investing more attractive because of the higher earnings yield and dividend payout from stocks, providing a good reason to participate in equity investing as institutional funds seek out higher yields.
4. Bonds and stocks are both on an uptrend since 2009. However, when looking at short-term swings, bonds and stocks have been moving in opposite directions. When stock prices are moving higher, bond prices would fall as interest rate rises, possibly to maintain some near-term yield parity across the two asset classes.
5. On the contrary, a stronger US dollar has not been that kind to the stock market. This could be due to the US dollar carry trade where US dollar was shorted by big players with the proceeds used to buy into US equities. When the US dollar rally, short-covering occurs and US equities had to be sold to raise funds to buy back the US dollar.
6. Bond prices are likely to lead in major stock market reversals so this will also be a key space to watch.

Conclusion
Understanding inter-market analysis is key to improving our ability to forecast the markets. While classical economic and financial theories hold up well most times, for the shorter-term, it would be important to understand the prevailing sentiments driving the markets. For instance, expectations on growth outlook, deflationary concerns (rather than inflationary due to QE), flight to safety and anticipation of Fed's policy responses interact to drive funds flowing into different asset classes at different times. Armed with this knowledge, you will be able to respond appropriately to what the market is telling us and stay invested in the right trending assets. Remember, as the markets swing from one extreme to the next, these provide further trading opportunities once you realise their relationships and are ready to position to take advantage of each swing.
While stock picking can help beat market performance, an occasional wrong pick could decimate a portfolio's returns. Company specific risks such as unexpected changes in management, changes in industry regulations, accounting fraud, litigation suits and loss of some big customers could potentially crush stock prices. Hence, for market-timers (swing traders) who are apprehensive of stock picking strategies, they can consider swing trading using sector ETFs. Afterall, a large part of a stock's price movement is tied to the sector movements. Leveraged sector ETFs, while volatile, can be quite safe as sectors don't collapse to zero values like stocks could while giving investors/traders an extra boost to otherwise slower but more stable index movements. There are many choices of sector ETFs to choose from and one should be looking at their liquidity and structures to ensure they are not easily manipulated and their structures are not faulty to what they are intended to measure and capture. ETFs can likewise be used to capture gains from inter-market correlations and movements as institutional funds rotate causing the regular ebb and flow we have seen across different asset classes.
Thanks for visiting. See you in two weeks' time!
Sunday, 11 November 2012
Intermarket Analysis - Part 1
Given the globalised nature of the financial markets and how risk-on and risk-off trades dictate the flow and movement of funds across various asset classes, intermarket analysis is fast becoming an important analytical and forecasting tool. Any stock market analysis without consideration of macro trends such as the dollar, bond, oil, precious metals and commodity markets is simply incomplete.
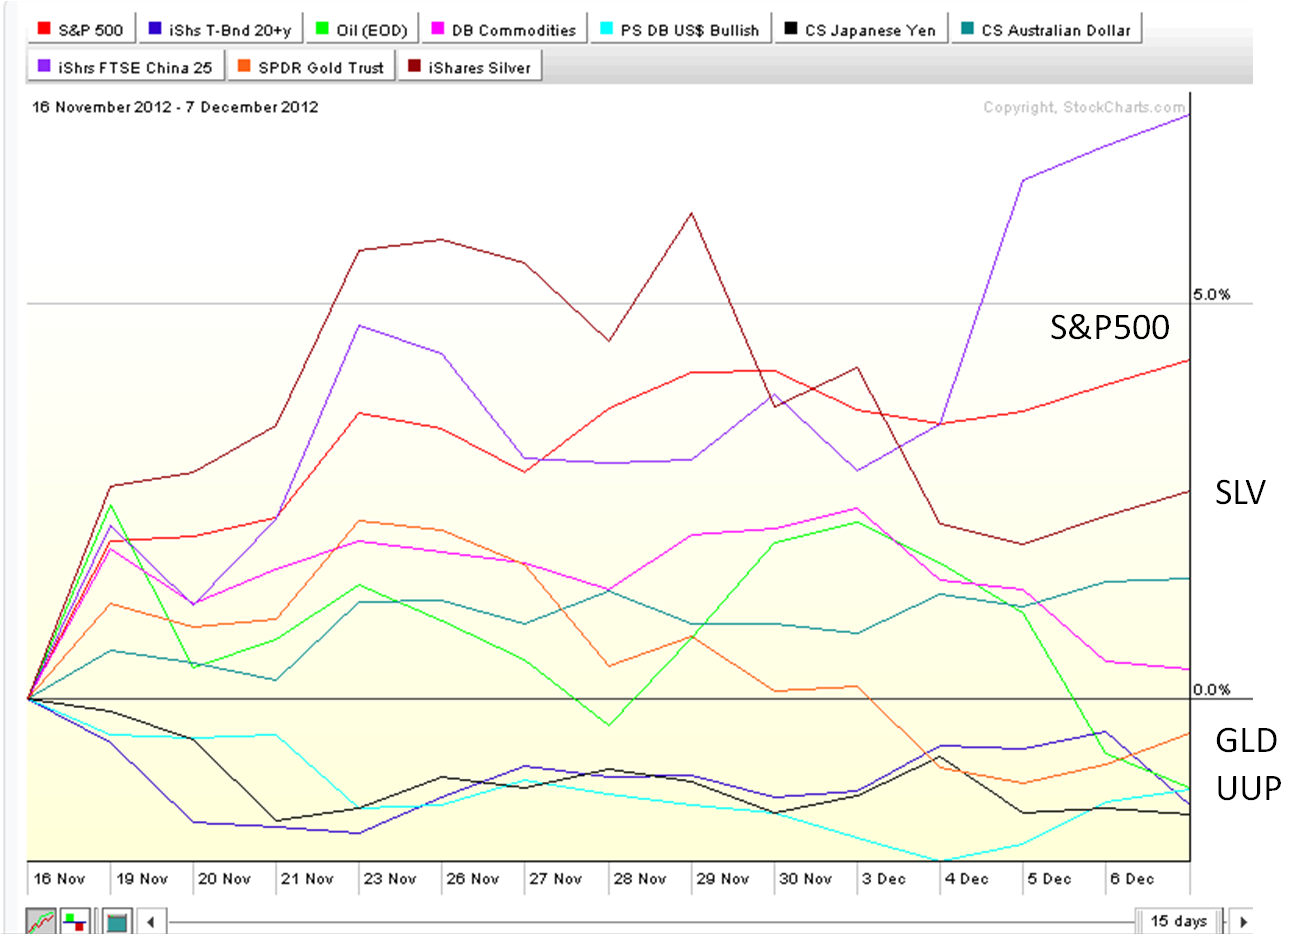
In this posting, I have established a few comparative charts between US and Chinese stocks, bonds, oil, commodities, US dollar, Japanese Yen, Australian dollar, Gold and Silver for recent periods when the US stock market declined (risk-off trade) and when it rallied (risk-on trade). There are altogether 5 periods as marked in the S&P chart below used for comparison.

a. Market Pull-Back - A
 b. Market Rally - B

c. Market Pull-Back - C

d. Market Rally - D
 e. Current Market Pull-Back - E
 Conclusion
As you can see, there are correlations between asset class movements during risk-on and risk-off periods. When market is in a risk-on mode, stocks rally and oil, commodities and Aussie dollar will rise. Safe haven assets like bonds, US dollar and Japanese yen tend to fall. It is interesting to note that Gold has no longer behaved like a safe haven asset in recent times. During risk-on period, precious metals like Gold and Silver (higher volatility) rally alongside stock markets, and will decline during risk-off period.
Understanding these macro relationships between asset classes will definitely help improve your analysis on stock market trends.
Given the globalised nature of the financial markets and how risk-on and risk-off trades dictate the flow and movement of funds across various asset classes, intermarket analysis is fast becoming an important analytical and forecasting tool. Any stock market analysis without consideration of macro trends such as the dollar, bond, oil, precious metals and commodity markets is simply incomplete.
In this posting, I have established a few comparative charts between US and Chinese stocks, bonds, oil, commodities, US dollar, Japanese Yen, Australian dollar, Gold and Silver for recent periods when the US stock market declined (risk-off trade) and when it rallied (risk-on trade). There are altogether 5 periods as marked in the S&P chart below used for comparison.

a. Market Pull-Back - A


c. Market Pull-Back - C

d. Market Rally - D


As you can see, there are correlations between asset class movements during risk-on and risk-off periods. When market is in a risk-on mode, stocks rally and oil, commodities and Aussie dollar will rise. Safe haven assets like bonds, US dollar and Japanese yen tend to fall. It is interesting to note that Gold has no longer behaved like a safe haven asset in recent times. During risk-on period, precious metals like Gold and Silver (higher volatility) rally alongside stock markets, and will decline during risk-off period.
Understanding these macro relationships between asset classes will definitely help improve your analysis on stock market trends.
Sunday, 28 October 2012
Sector Rotation : Short-term drivers - Part 5
Hi, welcome back!
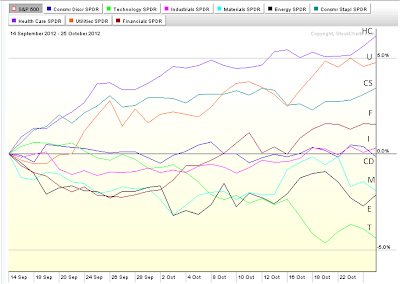
I am posting a few sector performance charts for the most recent market upleg from 4 Jun 2012 to 14 Sep 2012 and the current market downleg from 15 Sep 2012 till now.
For the most recent upleg, Energy and Finance had the strongest run, possibly in anticipation of QE3. Utility and Consumer Staples had underperformed the market.


The underperforming sectors (HC, U, CS) above in turn outperformed the market in the current downleg. Technology and Energy underperformed the market.

In the short-term, sentiments play an important role in deciding which sectors to overweight. For instance, market may sometimes value liquidity (eg. during the 2008 financial crisis, technology sector which has the most cash reserves and hence suffered the least decline despite it being an economically sensitive sector) or consistency in earnings (eg. during bearish pull-back where Consumer Staples may outperform).
The chart background is also important. Whichever sectors that have been beaten down hard during the market pullback may see the strongest bounce during the next market upleg, although sometimes these may be "dead-cat" bounce, depending on the longer-term underlying cyclical trends as the economy moves through various phases.
Less volatile and less economically sensitive sectors tend to outperform the market during downleg, and vice-versa. Lower beta sectors tend to outperform during market downleg, while higher beta sectors outperform during market upleg. This oscillating rhythm continues through different time-frames as institutional money flow in and out of various sectors.
Armed with this knowledge, you should have a watchlist of stocks in the sectors ready to run up when the current market correction ends (which should be soon).
See you in two weeks' time!
Hi, welcome back!
I am posting a few sector performance charts for the most recent market upleg from 4 Jun 2012 to 14 Sep 2012 and the current market downleg from 15 Sep 2012 till now.
For the most recent upleg, Energy and Finance had the strongest run, possibly in anticipation of QE3. Utility and Consumer Staples had underperformed the market.


The underperforming sectors (HC, U, CS) above in turn outperformed the market in the current downleg. Technology and Energy underperformed the market.


In the short-term, sentiments play an important role in deciding which sectors to overweight. For instance, market may sometimes value liquidity (eg. during the 2008 financial crisis, technology sector which has the most cash reserves and hence suffered the least decline despite it being an economically sensitive sector) or consistency in earnings (eg. during bearish pull-back where Consumer Staples may outperform).
The chart background is also important. Whichever sectors that have been beaten down hard during the market pullback may see the strongest bounce during the next market upleg, although sometimes these may be "dead-cat" bounce, depending on the longer-term underlying cyclical trends as the economy moves through various phases.
Less volatile and less economically sensitive sectors tend to outperform the market during downleg, and vice-versa. Lower beta sectors tend to outperform during market downleg, while higher beta sectors outperform during market upleg. This oscillating rhythm continues through different time-frames as institutional money flow in and out of various sectors.
Armed with this knowledge, you should have a watchlist of stocks in the sectors ready to run up when the current market correction ends (which should be soon).
See you in two weeks' time!
Sunday, 14 October 2012
Sunday, 23 September 2012
Quantitative Easing (Infinity) - What this means for your stocks?
Hi there, welcome back!
The market received a major boost last week with QE infinite (QE3) from the Fed. This will boost liquidity and support the slow but recovering property market in the US, which in turn will generate investment and consumption to enable the US economy to continue growing and generate employment, albeit slowly. Given the historically low yield elsewhere, stocks are positioned to rise. As such, I am going to dedicate today's posting on this important QE and resuming my discussion on sector rotation two weeks later.
I am sharing below a chart of the SP500 and how it responded to the past two rounds of QE.

From the chart above, you will observe that:
1. Following each QE, market rebounded or continued higher.
2. With the ending of each QE, market retreated.
3. Despite each time market pulling back on termination of QE, the SP500 has put in higher lows and higher highs. The market has remained on an uptrend, a positive sign.
4. Expectations on US and global economic fundamentals, corporate earnings performance, market valuation and next course of Fed actions have impacted on duration of market rally following each quantitative easing.
5. Following the current QE Infinite (or QE3), market may retest 1380 before heading higher, and likely posting new high soon. The indefinite buying of mortgage securities will continue to inject liquidity into the market keeping interest rates low. Historically, when earnings yield differential between stocks and treasuries is positive and high, ie. over 3% (like they are now), this makes a very compelling case to invest in stocks.
6. Within the equity asset class, the following may happen:
a. Consumer Discretionary stocks will benefit from low interest rates
b. Basic materials and Energy stocks will benefit but these stocks are also likely dependent on inflationary expectations and China growth
c. Gold stocks and gold miners will benefit from hedging against depreciating fiat currencies and inflation.
d. Financial instituations may benefit from lower borrowing cost and improved margins but have to bear in mind how the yield curve is shifting and headwinds in this industry.
e. Industrial stocks will benefit but beware if global recovery is slow, these stocks may tank soon if they become over-extended too quickly.
f. Technology stocks likely to rise, as innovation remains a bedrock to the US economy and growth likely to rise, justifying higher stock prices.
g. Biotechnology stocks will continue to rise as long as high growth story is intact.
h. REITS and high dividend paying stocks will be in favour given their high yeid.
i. Construction sector should continue to perform well as US property sector recovers.
j. Global companies with large international footprint will benefit as USD declines.
h. Stocks in healthcare, consumer staples and utilities may get lifted but as I have written in my earlier posts, these defensive stocks are likely to be laggard sectors as market takes on another leg higher.
So ride on the right side of the wave, and good sector and stock selection will improve odds in your favour.
Stay tuned!
Sunday, 26 August 2012
Sector Rotation: Short-term Rotation Charts - Part 4
Hello all, welcome back!
Given the impact sector rotation has on the outcome of investing, I will post a number of charts here detailing how the various sectors either had outperformed or underperformed the S&P500 over the last 13 years. From the charts, you will see how funds rotate during shorter phases of bull and bear market runs. Please bear in mind the charts here are shorter-term in focus (weeks and months) compared to the sector analysis done in earlier postings which generally delved into sector returns over medium to longer term. Shorter-term cycles are much more influenced by speculative moves in anticipation of and response to many factors such as government decisions on bail-out, intererest rate changes, bond purchases, wars, crisis, demand and supply of oil and commodities, strength of economies and even scandals rocking the markets. Often these serve as catalysts for an overbought sector to correct or for an oversold sector to rise, as evidenced in the following charts.
For the last decade or so, a significant part of the bull run was driven by asset inflationary pressures due to low rates for an extended period of time. There was expectation that countries like China would continue its unabated growth and hence, the demand for commodities and oil would continue to rise. There was a buoyant mood leading to Beijing Olympics 2008 despite soaring oil and and commodity prices exerting strains on global economic growth.

In the following charts, note how similar sectors rise and fall (relative to S&P500) during bull and bear market runs over past decade.


In summary, if you are a shorter-term investor or trader, it pays for you to understand the strongly trending sectors in a bullish market and the defensive sector positions you can take during a bearish market. Understanding sector rotation will keep you on the right side of the market and help reduce risks while improving profitability.
Sunday, 29 July 2012
Sector Rotation : Achieving Diversification Benefits - Part 3
In the last two postings, you have seen how investing in the strong trending sectors can outperform the market by an average of 25% per year. A worst performing sector, on the other hand, would have generated an average of 15.5% lower returns than market. Understanding where institutional funds are flowing based on an understanding of economic cycles will give us a clue on what the leading sectors will be. I also shared how a longer-term strategy of selecting low-volatility (ie. low beta) sectors will generate the best sector returns. Going further, it is possible to select low-volatility (ie. low beta) stocks from low-volatility (ie. low beta) sectors but with nice earnings growth to boost longer-term returns.
This week, I will touch on how sector investing, with its many benefits, can achieve diversification that will especially help during this decade of turbulence as we ride out the remaining half of the 20-year secular bear market.
First, you see from the table T1 below that 52% of a stock price movement is attributable to company specific developments, with the remaining half impacted by prevailing market and sector conditions. While local market influence on a stock price movement is waning (from 23% in 1995 to 15% in 2008), we see global sector influence on a stock price movement increasing (from 7% in 1995 to 18% in 2008).
Second, as seen in table T2, the correlation of monthly returns between SP500 and international EAFE index has risen from 0.5 in the 70s to 0.82 in the past decade. International investing hence gives little diversification benefits now as markets become more inter-connected due to globalisation.
Third, this correlation is even stronger during bear markets than bull markets as seen in the table below. A panic in one market can easily spread across to another like wild fire. International investing does little to diversify risks during bear markets, when capital preservation and risk reduction are most critical. This is evidenced in table T3.
Fourth, table T4 reveals that sector investing can be more effective in achieving diversification in a portfolio as correlations between sectors and S&P500 can go as low as 0.40 over the past 10 years.
In summary, if you have a relatively large portfolio and see the need and benefits to diversify, you will do better by investing in multiple different sectors than just investing across international markets. Due to globalisation, few markets, if any, are spared from any global meltdown.
In the last two postings, you have seen how investing in the strong trending sectors can outperform the market by an average of 25% per year. A worst performing sector, on the other hand, would have generated an average of 15.5% lower returns than market. Understanding where institutional funds are flowing based on an understanding of economic cycles will give us a clue on what the leading sectors will be. I also shared how a longer-term strategy of selecting low-volatility (ie. low beta) sectors will generate the best sector returns. Going further, it is possible to select low-volatility (ie. low beta) stocks from low-volatility (ie. low beta) sectors but with nice earnings growth to boost longer-term returns.
This week, I will touch on how sector investing, with its many benefits, can achieve diversification that will especially help during this decade of turbulence as we ride out the remaining half of the 20-year secular bear market.
First, you see from the table T1 below that 52% of a stock price movement is attributable to company specific developments, with the remaining half impacted by prevailing market and sector conditions. While local market influence on a stock price movement is waning (from 23% in 1995 to 15% in 2008), we see global sector influence on a stock price movement increasing (from 7% in 1995 to 18% in 2008).
 |
| T1 : Influences on stock performance |
Second, as seen in table T2, the correlation of monthly returns between SP500 and international EAFE index has risen from 0.5 in the 70s to 0.82 in the past decade. International investing hence gives little diversification benefits now as markets become more inter-connected due to globalisation.
 |
| T2 :Correlation of Monthly Returns : S&P500 vs EAFE |
Third, this correlation is even stronger during bear markets than bull markets as seen in the table below. A panic in one market can easily spread across to another like wild fire. International investing does little to diversify risks during bear markets, when capital preservation and risk reduction are most critical. This is evidenced in table T3.
 |
| T3 : Bear and Bull Market Correlation of Monthly Returns |
Fourth, table T4 reveals that sector investing can be more effective in achieving diversification in a portfolio as correlations between sectors and S&P500 can go as low as 0.40 over the past 10 years.
 |
| T4 : Correlations across sectors & S&P500 |
In summary, if you have a relatively large portfolio and see the need and benefits to diversify, you will do better by investing in multiple different sectors than just investing across international markets. Due to globalisation, few markets, if any, are spared from any global meltdown.
Sunday, 15 July 2012
Sector Rotation : Volatility & Returns - Part 2
Hello, welcome back!
In the last posting, I highlighted how sector returns vary as funds flow across sectors in anticipation of changes to economic and business cycles. As these trends are likely to last from months to several years, investing in the best stocks in the favoured and strongly trending sectors can give you a sustenable edge in investing.
This week, I will touch on the relationship between sector volatility and returns. If you are into sector investing and you also take a longer-term view towards investing, you should understand the volatility effect as many investors tend to overpay for volatile stocks over the long haul, most dramatically during bear markets.
To start off, beta has been a statistical measure introduced in the 1970s to determine how the investment return of any asset moved compared to the overall market. With the beta of the S&P500 index set as 1.0, stocks (or sectors) that have tended to swing more than the market will have betas above 1.0, and those less will have betas below 1.0.
Below is a sector beta matrix of the various sectors. You will see high median betas (or volatility) for sectors like Technology, Materials, Industrials and Consumer Discretionary. Conversely, the noticeably less volatile sectors are the likes of Utilities and Health Care. If you recall from the last posting, these are sectors that are in favour as funds seek safe shelters when fears about impending economic recession increase.

As you can see from the matrix above, sectors which are less volatile tend to have more stocks within them that are also less volatile (betas less than 1.0). For the longer-term investors, this can be the key to achieving lower risk yet without lower returns.
It is a well-documented fact that high-beta portfolios tend to deliver weak long-term returns with well above average risk. Why is this so? Shouldn't higher risks and higher returns go hand-in-hand? Not necessarily so, especially in the longer-term.
Because studies have found that low-volatility stocks generally underperform the market during up months but they will outperform the market during down months. The critical consideration is the underperformance during up months being considerably smaller than the outperformance during down months. The opposite is true for high-volatility stocks. And this trend holds true at the sector level as well as across subperiods and for different intervals of historical volality.
What this volatility effect reveals, in essence, is that investors tend to overpay for volatile stocks over the long haul, most dramatically during bear markets.
Below is a chart comparing the annualised returns of high-beta and low-beta sectors with the S&P500 over a 25 year period.

As you can see, the commonly held theory that you can do no better than the market without taking on more risk is flawed. In the long haul, it is possible to generate superior returns by investing in low volatility or low beta (ie. low risk) sectors. This applies to stock investing too as it is possible to find low-beta stocks which can also generate nice earnings growth and hence stock price appreciation.
This revelation will present a viable sector investing strategy for those more passive, longer-term investors who may not be inclined or ready to take advantage of opportunities arising from the rhythm and flow brought about by shorter-term sector rotation.
Sunday, 1 July 2012
Sector Rotation : Where the smart money flows - Part 1
Hi everyone, welcome back!
In the previous postings, we have made detailed observations and studies into the secular market cycles over the past century. This is important to successful investing because cyclical changes in market conditions often have a critical impact on assets allocation decisions and investing strategies and outcomes.
Successful investing requires understanding the movement of money and funds across asset classes, markets and critically, across sectors in the equity market (our focus today). Money flows from one sector to the next as price changes reflect varying degrees of growth and risk premiums in response to anticipated changes in macro conditions. Growth can relate to prospects of the companies or the economies while risk can relate to crisis unfolding in the industry, the companies themselves or the macro-economic and geopolitical uncertainties. In short, market prices will continuously seek to price in anticipated growth opportunities and risks.
As these trends are driven by some underlying fundamentals rather than technical considerations, they can last from months to even years. Hence sectors which are over-bought (over-sold) can remain over-bought (over-sold)for a long time.
In this posting, I will share with readers specifically the concept of Sector Rotation. To appreciate its importance, one only has to recognise that 50% of a stock's price movement can be attributed to its sector's price movement. If a sector is in favour (money pouring in), even mediocre stocks in this sector will perform well. As a rising tide lifts all boats. Conversely, if a sector is falling out of favour (money flowing out), even the best stocks in this sector will be hard pressed holding up their prices.
As different economic sectors are stronger at different points in the economic cycle, money will anticipate this and flow into different sectors at various points in time. Below is a Sector Rotation Model explaining which sectors may benefit at various points in the economic cycle. Note that the financial markets will always lead the physical economy by at least 6 months as investors collectively anticipate future developments. That is why you see stock markets bottoming out and rebounding when the physical economy may still be deep in recession and where maximum pessimism often prevails.
The economy and stock market cycles go through four phases.
1. Economy in full recession. Stock Market often bottoms out.
In this phase, economy is contracting, Fed cuts rates, consumer expectations bottoming and yield curve steepening.
Best performing sectors are: Basic Materials, Technology, Industrials and Finance
2. Economy in early recovery. Stock Market is in a bull run.
In this phase, economy starts to expand (moving out of recession), consumer spending rising, industrial production growing, yield curve turned upward sloping.
Best performing sectors are: Industrials (peaking near beginning of this phase), Technology (peaking near beginning of this phase), Consumer Discretionary, Energy (beginning near end of this phase)
3. Economy in full recovery. Stock Market topping.
In this phase, as economy expands strongly, Fed raising rates to fight near-term inflation, yield curve flattening, consumer expectations beginning to decline, industrial production flattening or declining.
Best performing sectors are: Energy (peaking near the beginning of this phase), Consumer Staples (beginning near the end of this phase), Health Care (beginning near the end of this phase)
4. Economy in early recession. Stock Market in a bear run.
In this phase, waning GDP growth, consumer expectations in the pits, industrial production declining, intrest rates are high and peaking, yield curve is flat or inverted as uncertainties about the future impact on long-term corporate borrowing and investments.
Historically profitable sectors are: Health care, Consumer staples, Utilities.
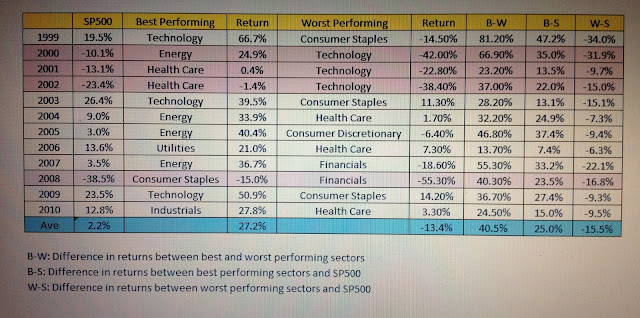
Below is the actual performance of the best and worst performing sectors since 1999. As you can see, pursuing a sector strategy can proof very profitable. The best performing sectors out-perform the S&P500 by an average of 25% while worst performing sectors under-perform the S&P500 by an average of 15.5%.
By identifying the strong sectors and buying the best stocks in only those sectors while avoiding stocks from out-of-favour sectors, you will have given yourself a critical edge with improved odds of successful investing. What is encouraging to note is one can out-perform the market without necessarily taking on excessive risks by being invested in these strong trending sectors or the best stocks found there.
In the next few postings, I will talk about how sector investing is more effective than international investing to achieve diversification benefits and by studying sector volatilities, to suggest a low-risk investing strategy that can still generate superior returns riding on sector momentum.
I will then share with you ways to identify strong trending sectors as money move into these sectors, which always will last for months or years, giving the investors adequate time to respond and take advantage of these opportunities.
Stay tuned in two weeks' time!
Hi everyone, welcome back!
In the previous postings, we have made detailed observations and studies into the secular market cycles over the past century. This is important to successful investing because cyclical changes in market conditions often have a critical impact on assets allocation decisions and investing strategies and outcomes.
Successful investing requires understanding the movement of money and funds across asset classes, markets and critically, across sectors in the equity market (our focus today). Money flows from one sector to the next as price changes reflect varying degrees of growth and risk premiums in response to anticipated changes in macro conditions. Growth can relate to prospects of the companies or the economies while risk can relate to crisis unfolding in the industry, the companies themselves or the macro-economic and geopolitical uncertainties. In short, market prices will continuously seek to price in anticipated growth opportunities and risks.
As these trends are driven by some underlying fundamentals rather than technical considerations, they can last from months to even years. Hence sectors which are over-bought (over-sold) can remain over-bought (over-sold)for a long time.
In this posting, I will share with readers specifically the concept of Sector Rotation. To appreciate its importance, one only has to recognise that 50% of a stock's price movement can be attributed to its sector's price movement. If a sector is in favour (money pouring in), even mediocre stocks in this sector will perform well. As a rising tide lifts all boats. Conversely, if a sector is falling out of favour (money flowing out), even the best stocks in this sector will be hard pressed holding up their prices.
As different economic sectors are stronger at different points in the economic cycle, money will anticipate this and flow into different sectors at various points in time. Below is a Sector Rotation Model explaining which sectors may benefit at various points in the economic cycle. Note that the financial markets will always lead the physical economy by at least 6 months as investors collectively anticipate future developments. That is why you see stock markets bottoming out and rebounding when the physical economy may still be deep in recession and where maximum pessimism often prevails.
 |
| Source: Sam Stovall's S&P's guide to sector rotation. |
The economy and stock market cycles go through four phases.
1. Economy in full recession. Stock Market often bottoms out.
In this phase, economy is contracting, Fed cuts rates, consumer expectations bottoming and yield curve steepening.
Best performing sectors are: Basic Materials, Technology, Industrials and Finance
2. Economy in early recovery. Stock Market is in a bull run.
In this phase, economy starts to expand (moving out of recession), consumer spending rising, industrial production growing, yield curve turned upward sloping.
Best performing sectors are: Industrials (peaking near beginning of this phase), Technology (peaking near beginning of this phase), Consumer Discretionary, Energy (beginning near end of this phase)
3. Economy in full recovery. Stock Market topping.
In this phase, as economy expands strongly, Fed raising rates to fight near-term inflation, yield curve flattening, consumer expectations beginning to decline, industrial production flattening or declining.
Best performing sectors are: Energy (peaking near the beginning of this phase), Consumer Staples (beginning near the end of this phase), Health Care (beginning near the end of this phase)
4. Economy in early recession. Stock Market in a bear run.
In this phase, waning GDP growth, consumer expectations in the pits, industrial production declining, intrest rates are high and peaking, yield curve is flat or inverted as uncertainties about the future impact on long-term corporate borrowing and investments.
Historically profitable sectors are: Health care, Consumer staples, Utilities.
Below is the actual performance of the best and worst performing sectors since 1999. As you can see, pursuing a sector strategy can proof very profitable. The best performing sectors out-perform the S&P500 by an average of 25% while worst performing sectors under-perform the S&P500 by an average of 15.5%.

By identifying the strong sectors and buying the best stocks in only those sectors while avoiding stocks from out-of-favour sectors, you will have given yourself a critical edge with improved odds of successful investing. What is encouraging to note is one can out-perform the market without necessarily taking on excessive risks by being invested in these strong trending sectors or the best stocks found there.
In the next few postings, I will talk about how sector investing is more effective than international investing to achieve diversification benefits and by studying sector volatilities, to suggest a low-risk investing strategy that can still generate superior returns riding on sector momentum.
I will then share with you ways to identify strong trending sectors as money move into these sectors, which always will last for months or years, giving the investors adequate time to respond and take advantage of these opportunities.
Stay tuned in two weeks' time!
Sunday, 24 June 2012
Sunday, 17 June 2012
Market History: Secular Cycles & Fundamental Valuations - Part 5
Hello everyone! We've spent the past couple of weeks identifying bull and bear secular cycles over the past 90 years. We've examined how these cyclical markets were formed as macro-economic policies taken in response to prevailing economic and geo-political conditions often have long lasting ramifications over the next decade or so that can swing the economy from one extreme to the other. Periods of contraction would led to expansion to inflation and as cooling measures took shape, the economy would contract once again sometimes leading to deflation. Likewise, investors can swing from feeling euphoric to great fear as market tops and bottoms are often formed during these extreme sentiments. And so the boom and bust cycles continue from one extreme to the next.
We've seen how interest rates, foreign exchange rates, budget deficits, taxes, fiscal policies, wars and crisis of different kinds have also unfolded to bring about many trends and counter-trends in the markets.
Today, I am going to share with you how valuations have also historically trended in cycles. This will have important implications for investors as I will explain later.
From the chart below, you can see market trailing PEs oscillate between a low of 6.64 to a high of around 24 for most part of history. Historical average is around 16. Market PEs generally rise during secular bull markets and fall during bear markets. We saw big spikes in market valuations (PEs over 40) over the last decade that quickly led to a crash in prices following the sky-high valuations for internet companies and the subsequent boom in energy and commodity prices.

Because of the cyclical nature of prices and the expansion and contraction phases of EPS due to business cycles, it is critical for investors to realise that buying equities at different market PE levels will produce varying returns, even if held over the long-term like 10 years. This will have an important implication for asset-allocations.
To illustrate this, I have produced another chart below overlaying the 10-year subsequent returns (annualised) following each year's recorded market PE. You can see initiating purchases of equities during high market PE levels are unattractive as the coming 10-year returns could even be negative (-1.38%). In contrast, buying at lower market PE levels could yield over 20% annualised returns in the subsequent 10 years!

Hence, despite the well-known fact that long-term average return for equity investments is an annualised 9.37% (between 1930 and 2010), the actual disparity in returns for equity investors can be huge. The critical consideration is your point of entry.
Equity markets can only advance strongly through a combination of higher earnings and a low starting market PE ratio.
Given our current market PE is at long-term average of about 16, and Q ratio (measure of market value over book value) is currently above 1.2 (over-valued) and that we are currently in the midst of a secular bear market which may likely mean slowing EPS growth, probability of mean reversion is high.
In conclusion, from a fundamentals perspective using market valuation analysis, we have now arrived at a similar outlook on the equity market in line with the secular bear market trend we have observed earlier from the charts. Equity investments are likely to produce relatively sluggish returns below the historical market norms for the coming 8-10 years - the remaining span of this secular bear market we are currently in.
Sunday, 10 June 2012
Sunday, 3 June 2012
Market History: Secular Cycles - Part 4
The start of the new millennium coincided with the beginning of the next secular market cycle. Ever since the end of World War 2, credit has expanded faster than GNP. Government debt expansion, an easy monetary environment and increased use of leverage by consumers and corporations further contributed to inflationary asset growth and a record economic boom since the early-80s.
# 2000 - 2020 : Secular Bear Market
The super bubble that formed, dating to its inception to 1980, inevitably led to a cycle of bust as prices must revert towards the equilibrium level at some point in time. Since year 2000 (a span of just 12 years), the equity markets already witnessed 2 severe crashes, one correction and another flash crash - a definitive characteristic of a secular bear market we are currently in.
The severe plunge of Nasdaq (and along with it, the Dow and S&P) in year 2000
saw a total of $8 trillion in wealth lost in the market decline. The internet euphoria led to the unfounded belief that in the new age economy of the new millennium, company valuations were less important or relevant in view of the limitless growth potential arising from this internet revolution and how the world could be transformed. By year 2000, stocks were trading in the hundreds and some in the thousands on a P/E basis. The IPO market even had new companies losing tons of money with no hope of profit until many years down the road but trading at over 1 billion dollar market cap.
Stocks were certainly over-valued. At the same time, there were problems brewing in the market. Corporate fraud saw many companies like Worldcom and Enron inflated their profits by means of shady accounting practices to hide debts and inflate revenue and assets to mislead banks, investors and regulators. Corporate officers awarded themselves with outrageous stock options that diluted sharholders' value. Conflict of interests also arose as analysts and investment bankers worked closely together such that whenever a company was trying to raise capital, the investment bankers made sure their research firms would put favourable ratings on stocks, misleading the investing public. In some cases, analysts had favorable ratings on stocks less than a month before the companies filed for chapter 11 (bankruptcy). The advent of the internet and online trading at around that time also gave many individuals a quick and cheap way to trade the markets. This led to millions of new traders hitting the markets with little or no experience, further driving up prices by these retail investors before reality returned and the market caved in.
In 2008, the stock market cratered as another financial crisis struck, one that would trigger what would be known as the Great Recession. Had it not been for the sustained and concerted government intervention to support the financial markets, the collapse would have much more disastrous consequences on a global scale that could surpass the Great Depression of 1929. While inflationary pressure such as from rising oil and commodity prices threatened global economic growth, it was the US housing meltdown that triggered the Great Crash of 2008.
The crisis could be traced back to the Government's desire and drive to promote home ownership amongst Americans as it became an important political agenda to win electoral votes. A robust construction sector also bode well for the economy. Unfortunately, the Federal Reserve supported this political objective by keeping interest rates artificially low for too long a period while encouraging banks to expand mortgage credit. Demand for mortgages rose rapidly as Americans not only borrowed to finance the house they lived in but also overleveraged to purchase more houses to flip in anticipation of a quick profit. As the mortgage market became very competitive, mortgage brokers proliferated and banks started to drastically drop underwriting standards in order to keep or grow their market shares. They dropped income requirement criteria and sold ARM (Adjustable Rate Mortgages) to make the new mortgages affordable in anticipation that home prices would continue to rise and that would allow borrowers to re-finance when higher rates kicked in later. Basic credit principles were cast away. Banks instead resorted to loan securitisation which effectively removed mortgage assets from their books, believing their credit risks were eliminated while freeing up capital to underwrite even more mortgages. All these while, regulators subscribed to the ideal of a free market economy from the Reagan years and scorned at over-regulation. Federal Reserve and the Congress continued to prefer a laissez-faire attitude towards supervising banks and the derivatives markets. The Federal Reserve also mistakenly believed that loan securitisation would indeed help remove risks from the US banking system as these securitised assets were sold to investors elsewhere and globally and the resultant risks would be effectively diversified. To make these mortgage-backed securities or Collateralised Debt Obligations (CDOs) more attractive to investors, insurance companies like AIG provided default insurance while rating agencies like S&P and Moodys accorded top credit ratings to these derivatives. To manage these risks, there were also many financial swap transactions involving various financial and non-financial institutions, that effectively created huge and highly complex counter-party risks when the crisis eventually unfolded.
The housing market collapse soon led to a collapse in the CDO and CDS markets as these derivatives were basically written on unsound sub-prime mortgages. Many banks, insurance companies and even pension funds were severely implicated as holders of these supposedly safe derivatives. The collapse of Lehman Brothers sparked off a panic and rapid loss of confidence in the entire banking system as the extent and magnitude of losses from counter-party obligations became too complex to determine. Banks became fearful of lending to each other which effectively froze the money markets. This led to the Federal Reserve stepping up its lending in the money markets and structuring TARP bailout of the major financial institutions whose capital base was decimated but deemed "too big to fail" like AIG, Citigroup, Bank of America and JP Morgan. Their collapse was thought to pose severe systemic risks to the global financial system. FDIC took steps to assure depositors to avert potential bank runs. Freddie Mac and Fannie Mae were re-consituted and so were companies like General Motors as the housing market collapse caused a widespread decline in economic activity in the US and across the world. The housing collapse was further exercabated by the glut of homes the developers built during the boom years creating a supply overhang currently. The volume of foreclosure added to the supply glut that would continue to keep US home prices depressed for a number more years to come (see my earlier post in this blog captioned "Future of the US" on how and when the economy and housing market would turn around).
The Federal Reserve expanded its balance sheet as part of its quantitative easing program to keep rates low to fight deflation and unemployment. It actively bought Treasuries and Mortgage-Backed securities to keep rates low so the housing market could stabilise and banks hopefully would be incentivised to lend more given the wide lending margin which in turn would enhance their earnings and help re-capitalise them.
Consequently, the US government ran into record budget deficits of around $1.4 trillion annually since 2009 or around 10% of GDP each year. Simply stated, $1.4 trillion is approximately the amount of debt the US accumulated from its founding until 1984. In a single year, the US government would outspend its income by as much as it did during two entire centuries of cross-continental expansion, civil war, depression, world wars and the implemenation of the modern social welfare state. Going forward, it is likely to add more than $900 billion a year to its national debt. The largely monetary policies so far have helped avert a deep-seated recession and yet inadequate to stimulate employment growth. The massive US budget deficit offered little hope for fiscal stimulus unless tax policy changes are made as well as government spending on social security and the military reformed.
The two major crashes in this secular bear market were violent and would take a longer time to recover.
(a) Dot-Com Crash of 2000
- Nasdaq declined 79% (from peak of 5132) over 30 months
- Nasdaq has not reclaimed its prior peak till today
- SP500 declined 49% over 30 months
- SP500's full recovery took 60 months
(b) Financial Crisis of 2008
- Market declined 58% over 18 months
- Market has not reclaimed its prior peak till today
Outlook
US economic growth is likely to muddle along over next few years till end of this decade unless external shocks like Eurozone became severe enough to derail its growth. Strong growth in foreign economies, especially those in Asia and China, pent-up consumer and business demand and an accomodative monetary policy are likely to support growth in the US in the near-term. Yet, there remains challenges such as a huge deficit, unemployment, tepid housing market, risk of inflation in future and policy uncertainties from the next administration(s).
Meanwhile, corporate earnings growth remain strong and resilient with record cash per share. Reinvestment will return when market clarity improves and that should further boost earnings growth justifying higher share prices.
By 2020 (end of this secular bear market), Dow should be trading between 15,000 and 18,000, S&P500 between 1,500 and 2,000 while Nasdaq should exceed 4,000 points.
Sluggish growth and volatilities are likely characteristics defining the equity market till 2020.
Monday, 21 May 2012
Sunday, 13 May 2012
Market History: Secular Cycles - Part 3
Hi, everyone. For many, the market volatility persisting over the past decade is disturbing. Will we see better times ahead? Let's get on with this part of the analysis on historical market cycles.
# 1980 - 1999 : Secular Bull Market
Since 1965 when President Johnson increased deficit spending to fund the Vietnam war, inflationary pressure began building. The collapse of the Bretton Woods system, the de-linking of USD to Gold in 1971 and the consequent oil crisis in 1974 and 1979 further fuelled inflationary pressures. Soaring oil prices compelled many American businesses to raise prices. Food harvest failures around the world at this time led to soaring prices on the world food market. High inflationary expectations led to a self-fulling cycle of higher prices.
By early 80s, runaway prices pushed inflation to 13.5% while unemployment rate reached 9.7%. US was experiencing stagflation. To wring inflationary expectations out of the system, Paul Volcker was nominated by President Carter as Chairman of Fed and he decided to put the nation through an intentional recession by raising rates. Fed's discount rate went to as high as 14 percent in 1981. Prime rate in the US hit a record 21.5% around that time.
By 1982, inflation abated. The war against inflation was won. Monetary policy was substantially eased and President Reagan introduced tax cuts and continued with deregulations. Within months, the economy roared to life and took off on an expansion that would last 7 years - the greatest peace time expansion in US history.
Geo-politically, the Cold War came to an end with the collapse of Soviet Union. In the middle-east, Iraq invaded Kuwait that led to a subsequent US invasion on Kuwait and attack on Iraq.
One notable market crash occured this period was The Black Monday crash. In a single day, the Dow fell 22.6%, wiping out $600billion in market capitalisation. The prior bull market had been fueled mostly by hostile takeovers, leveraged buyouts and "merger mania", a believe at that time that companies could grow exponentially simply by purchasing other companies. Consequently, there was a scramble to raise capital to finance these buyouts including issuing junk bonds to the public. Many shady IPOs were proliferating while investors were caught up in a contagious euphoria punting on these companies disregarding their true valuations. Insider trading was becoming rampant. Seeing a growing inflationary concern, the Fed began raising short-term interest rates to temper the economy and stock market. The barrage of SEC investigations and crack-down on insider trading further rattled investors who decided by October to exit what they now believed to be a rigged game and move into more stable fixed income securities (whose yields rose from just 7.4% at beginning of 1987 to over 10% in the summer before the crash). While some attested the crash to program trading, portfolio insurance, proliferation of derivatives, market illiquidity and over-valuation, these are really structural issues that would not trigger the panic selling. Rather the market was responding to failings in regulatory regime and congressional policies that undermined market integrity resulting in loss in investor confidence culminating in Black Monday.
The 1990s were also boon years for the economy. Helped by increased tax receipts as a consequence, President Clinton achieved a surplus budget which reduced the debt burden accumulated under the Reagan and Bush years. This helped keep interest rates low arising from reduced government borrowing which in turn spurred the economy. The economic boom of the 1990s was the longest sustained period of growth in American history. Unemployment and inflation fell to their lowest levels in 40 years. The stock market soared on the back of the dot-com boom, wages rose, crime rates fell, and the number of people on welfare declined.
Over this 20-year period, the US economy grew over 3.4 times larger, market EPS quadrupled and S&P soared from 140 to 1500 (over 10 times).
During this secular bull market, there were a few market corrections.
(a) Correction A - 1981 - Paul Volcker bitter medicine
- Market declined 28% over 20 months
- Full recovery took 3 months
(b) Correction B - 1983
- Market declined 12% over 16 months
- Full recovery took 6 months
(c) Correction C - 1987 (Black Monday crash)
- Market declined 32% in 1 month
- Full recovery took 22 months
(d) Correction D - 1991 - pre- Iraq / Kuwait war
- Market declined 21% in over 3 months
- Full recovery took 4 months
(e) Correction E - 1998
- Market declined 25% in over 3 months
- Full recovery took 2 months
Nonetheless, secular bull markets tend to be resilient with shallower corrections and generally shorter recovery periods. In the next posting, we will examine the most recent 10 years in this new millenium and postulate where we will go from here in the coming years.
Sunday, 6 May 2012
Sunday, 29 April 2012
Market History: Secular Cycles - Part 2
Hi, thanks for returning! I wrote about cycles last week and attempted to identify the secular cycles persisting since a century ago. Let's continue with our journey.
# 1940 - 1959 : Secular Bull Market
As US was drawn into World War 2, the US Federal government ran enormous deficits to fund the war against the Nazis in Europe and Japanese in Far East. Government spending % GDP rose to over 53% while debt % GDP exceeded over 110% during the war years. After the war, massive US investments and loans were made to re-build war-torn Europe and Japan. The war brought about rapid expansion to the sluggish US economy otherwise still in the throes of the Great Depression. Peace and prosperity returned for most Americans.
In an effort to free international trade and fund postwar reconstruction, nations began fixing their exchange rates by tying their currencies to the US dollar (Bretton Woods agreement) as the US government pledged a US dollar to 35 oz of gold bullion. The US dollar became a reserve currency for many nations and it began replacing the Sterling pound as the currency for international trade and commerce. The start of the Gold standard ushered in the golden age of the US dollar.
The end of WW2 also created heightend state of tension between the former Soviet Union and US as each fought for supremacy and over ideological differences. The fight against fascism and imperialism in WW2 had turned into a containment war against communism. This brought about the US invasion of Korea in the South in 1950 as fear escalated that Soviet Union would "export" communism to other Asian nations, following the fall of the Nationalist government in China to communist Mao.
Over this 2-decade period, corporate earnings rose strongly. Market EPS grew from $0.10 in 1940 to $0.35 by 1959 (3.5 times increase) buoying the S&P500 from 13 to 60 (4.6 times increase). US economy grew by 5 times over same period. This strong market performance, coupled with only shallow pullbacks, had all the makings of a secular bull market. This was the golden era for the US and Americans.
(a) World War 2 (1939-1945):
- Market declined 38% over 30 months
- Full recovery took 26 months
(b) Korean War (1950-1953):
- Market actually moved higher by over 20% during this period.
# 1960 - 1979 : Secular Bear Market
While the US economy continued to grow strongly over the following 2 decades, the world was plagued by regional conflicts (such as in Middle East and the Vietnam War) and significant turbulences in the world's economic system. President Kennedy was also assassinated in 1963.
Apart from the Cold War rivalry between the former Soviet Union and the US which culminated into an arms race and a race into space (US Apollo landing on the moon in 1969), the collapse of the Bretton Woods system in 1971 created huge market turmoil when the US dollar was offically de-linked from gold and exchange rates were allowed to float. This transition to a fiat currency and managed float system was rocky and characterized by plummeting stock prices, skyrocketing oil prices, bank failures and severe inflation. This set off a decline of the US dollar and appreciation of gold prices, reaching $800 an oz by 1979.
In the midst of these turbulences, Nasdaq opened in 1971 and a few important technological innovations were achieved in the US. ARPANET, a predecessor of the Internet we know today, was set up in 1969 by the US Department of Defense in partnership with four universities. The first desktop computer (Altair) was developed in 1974. A powerful technological revolution that was taking shape in the US eventually led to a multi-decade run-up in Nasdaq, reaching a high of 5000 points in 2000 from low of 55 in 1974 (a 90-fold increase over a 25-year period).
By end-1979, the US economy expanded by 4.9 times compared to where it was in 1960. Market EPS grew from $0.35 in 1960 to $1.50 by 1979 (4.3 times increase) but S&P was at around 140, just about 2.3 times higher than it was 20 years earlier. This period also witnessed 4 market corrections of at least 20%. This was a secular bear market for equities characterised by slower price growth, increased volatilities and more frequent and steeper corrections.
(a) Correction 1 (1962) - Cuban crisis
- Market dropped 28% over 3 months
- Full recovery over next 10 months
(b) Correction 2 (1966)
- Market dropped 21% over 8 months
- Full recovery over next 7 months
(c) Correction 3 (1969)
- Market dropped 35% over 17 months
- Full recovery over next 22 months
(d) Correction 4 (1973) - Oil crisis / Arab Oil Embargo / Nixon's resignation
- Market dropped 46% over 21 months
- Full recovery only 6 years later
Please tune in again next week.
We will conclude our market analysis and we will find out where we are now in the cycle and make an attempt to see where our future will head towards.
Sunday, 22 April 2012
Market History: Secular Cycles - Part 1
Hi, welcome back. For this week and next, I will walk you through a brief journey back in time. A study on financial markets history is always instructive to understand how markets will behave.
Scientists are beginning to discover that the Universe manifests itself in countless observable cycles. From the smallest sub-atomic particles to the largest clusters of galaxies, they follow some kind of cyclic yin-yang order or rhythm. Likewise, societies progress, mature and decline before renewal sets off yet another cycle. What about the financial markets?
Prices may appear to move randomly, but with study show an underlying order and structure. Cycle analysis, Elliot waves, Kondratieve waves, Gann squares, angles, Fibonacci relationships and even postulations of planetary influences on financial markets are constructs and tools to help us uncover this underlying order. Psychologists and economists have also given a go at explaining the cycles of market boom and bust by attributing them to human behaviour through emotional cycles of extreme greed and fear, creating maximum energy at levels where turning points often happen. So, it seems, cycles are everywhere.
Recently, i purchased some data of the major US stock market indices over the past 100 years. When you have an opportunity to look at these vast amount of data plotted on a large chart, you will be amazed to see how the secular cycles (each lasting approximately 20 years) playing out in the stock market over the past century.
To many investors, the critical question is to know where we are now in the cycle so we can have some foreknowledge of what may be coming our way. Some call this forecasting.
In this and the next posting, I will share with you the secular cycles over the past century that I have identified from the charts. Whether to help you better prepare for the next looming crisis or just to pique your curiosity, I will outline the various crisis in each of these secular markets. I have also computed the exact magnitude the market moved and the time taken for a full recovery each time a crisis occured. You should find this information instructive. In each large secular cycle, there are usually one or more shorter counter-trend cycles.
So let's get started now! Back to the year 1906 we go.
# 1906-1919 : Reformative years
In the beginning of times, chaos reigned. Regulations and oversight in the financial markets were lacking and financial panics were rife. This was also the period where US continued to build on its industrial might having recently overtaken England as the world's largest economy. Ford Model T was introducted in 1908 and later that year, General Motors was formed. Technological feat led to the opening of the Panama Canal in 1914. War War 1 broke out later that year. The war actually accelerated growth for the US economy, bringing US GNP closer to $100 billion before the next decade arrived. The financial markets however remained flat over this period, as banking and currency reforms gradually took shape. Dow was at 110 points by end-1919, almost the same level as it was 13 years earlier.
(a) Panic of 1907:
- Market dropped 45% over 9 months.
- Full recovery 10 months later.
(b) World War 1 (1914-1918):
- Market gapped down 33% when it was re-opened after closure.
- Full recovery 9 months late, buoyed by growth from the war itself.
# 1920 - 1939 : Secular Bear Market
The 1920s was also known as the "Radio Age" where radio found its way into most American homes. This was also a dark age period for many Americans. The effects of Great Depression (1929) haunted the country for at least the next decade to come.
For the first 10 years during this secular bear market, the Dow actually rose from 110 points to almost 400 points. By 1929, with the onset of the Great Depression, the market not only gave back all its recent gains but turned into a steep loss. Such is the characteristic of a secular bear market where you expect to see wild swings and huge volatilities. The market collapse led to the formation of the Securities & Exchange Commission (SEC) in 1934. That year, Gold price was fixed at $35. By end-1939, Dow was back to a mere 150, closer to where it started two decades earlier. This was also a difficult time for the US economy. Its GNP recorded almost "zero" economic growth for a 20-year period. Literally, this secular bear market represented 2 lost decades for America and its people.
(a) Stock market crash of 1929:
- Market plunged 90% over 36 months.
- Full recovery took 25 years before Dow regained 400 points level.
Hope you had a fascinating read. Check in here again next week to find out where we are currently in the cycle and where we may go from here!
Subscribe to:
Comments (Atom)