Hi, welcome back!
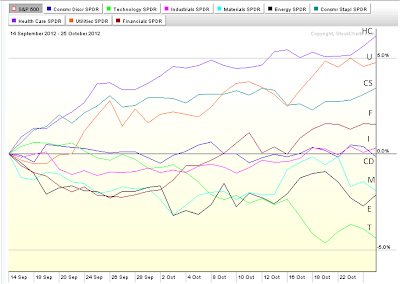
I am posting a few sector performance charts for the most recent market upleg from 4 Jun 2012 to 14 Sep 2012 and the current market downleg from 15 Sep 2012 till now.
For the most recent upleg, Energy and Finance had the strongest run, possibly in anticipation of QE3. Utility and Consumer Staples had underperformed the market.
The underperforming sectors (HC, U, CS) above in turn outperformed the market in the current downleg. Technology and Energy underperformed the market.
In the short-term, sentiments play an important role in deciding which sectors to overweight. For instance, market may sometimes value liquidity (eg. during the 2008 financial crisis, technology sector which has the most cash reserves and hence suffered the least decline despite it being an economically sensitive sector) or consistency in earnings (eg. during bearish pull-back where Consumer Staples may outperform).
The chart background is also important. Whichever sectors that have been beaten down hard during the market pullback may see the strongest bounce during the next market upleg, although sometimes these may be "dead-cat" bounce, depending on the longer-term underlying cyclical trends as the economy moves through various phases.
Less volatile and less economically sensitive sectors tend to outperform the market during downleg, and vice-versa. Lower beta sectors tend to outperform during market downleg, while higher beta sectors outperform during market upleg. This oscillating rhythm continues through different time-frames as institutional money flow in and out of various sectors.
Armed with this knowledge, you should have a watchlist of stocks in the sectors ready to run up when the current market correction ends (which should be soon).
See you in two weeks' time!


No comments:
Post a Comment