Sunday, 29 July 2012

Sector Rotation : Achieving Diversification Benefits - Part 3

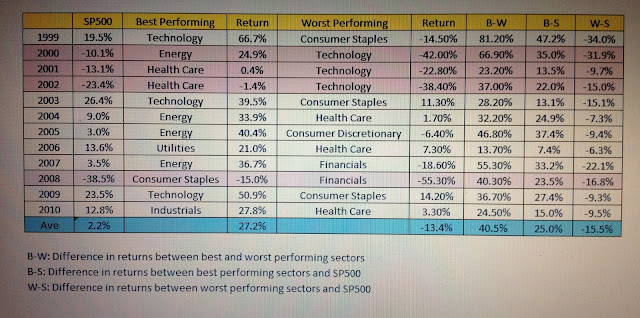
In the last two postings, you have seen how investing in the strong trending sectors can outperform the market by an average of 25% per year. A worst performing sector, on the other hand, would have generated an average of 15.5% lower returns than market. Understanding where institutional funds are flowing based on an understanding of economic cycles will give us a clue on what the leading sectors will be. I also shared how a longer-term strategy of selecting low-volatility (ie. low beta) sectors will generate the best sector returns. Going further, it is possible to select low-volatility (ie. low beta) stocks from low-volatility (ie. low beta) sectors but with nice earnings growth to boost longer-term returns.

This week, I will touch on how sector investing, with its many benefits, can achieve diversification that will especially help during this decade of turbulence as we ride out the remaining half of the 20-year secular bear market.

First, you see from the table T1 below that 52% of a stock price movement is attributable to company specific developments, with the remaining half impacted by prevailing market and sector conditions. While local market influence on a stock price movement is waning (from 23% in 1995 to 15% in 2008), we see global sector influence on a stock price movement increasing (from 7% in 1995 to 18% in 2008). 

T1 : Influences on stock performance

Second, as seen in table T2, the correlation of monthly returns between SP500 and international EAFE index has risen from 0.5 in the 70s to 0.82 in the past decade. International investing hence gives little diversification benefits now as markets become more inter-connected due to globalisation. 


T2 :Correlation of Monthly Returns : S&P500 vs EAFE

Third, this correlation is even stronger during bear markets than bull markets as seen in the table below. A panic in one market can easily spread across to another like wild fire. International investing does little to diversify risks during bear markets, when capital preservation and risk reduction are most critical. This is evidenced in table T3.

T3 : Bear and Bull Market Correlation of Monthly Returns

Fourth, table T4 reveals that sector investing can be more effective in achieving diversification in a portfolio as correlations between sectors and S&P500 can go as low as 0.40 over the past 10 years.

T4 : Correlations across sectors & S&P500


In summary, if you have a relatively large portfolio and see the need and benefits to diversify, you will do better by investing in multiple different sectors than just investing across international markets. Due to globalisation, few markets, if any, are spared from any global meltdown.


Sunday, 15 July 2012

Sector Rotation : Volatility & Returns - Part 2

Hello, welcome back!

In the last posting, I highlighted how sector returns vary as funds flow across sectors in anticipation of changes to economic and business cycles. As these trends are likely to last from months to several years, investing in the best stocks in the favoured and strongly trending sectors can give you a sustenable edge in investing.

This week, I will touch on the relationship between sector volatility and returns. If you are into sector investing and you also take a longer-term view towards investing, you should understand the volatility effect as many investors tend to overpay for volatile stocks over the long haul, most dramatically during bear markets.

To start off, beta has been a statistical measure introduced in the 1970s to determine how the investment return of any asset moved compared to the overall market. With the beta of the S&P500 index set as 1.0, stocks (or sectors) that have tended to swing more than the market will have betas above 1.0, and those less will have betas below 1.0.

Below is a sector beta matrix of the various sectors. You will see high median betas (or volatility) for sectors like Technology, Materials, Industrials and Consumer Discretionary. Conversely, the noticeably less volatile sectors are the likes of Utilities and Health Care. If you recall from the last posting, these are sectors that are in favour as funds seek safe shelters when fears about impending economic recession increase.


As you can see from the matrix above, sectors which are less volatile tend to have more stocks within them that are also less volatile (betas less than 1.0). For the longer-term investors, this can be the key to achieving lower risk yet without lower returns.

It is a well-documented fact that high-beta portfolios tend to deliver weak long-term returns with well above average risk. Why is this so? Shouldn't higher risks and higher returns go hand-in-hand? Not necessarily so, especially in the longer-term.

Because studies have found that low-volatility stocks generally underperform the market during up months but they will outperform the market during down months. The critical consideration is the underperformance during up months being considerably smaller than the outperformance during down months. The opposite is true for high-volatility stocks. And this trend holds true at the sector level as well as across subperiods and for different intervals of historical volality.

What this volatility effect reveals, in essence, is that investors tend to overpay for volatile stocks over the long haul, most dramatically during bear markets.

Below is a chart comparing the annualised returns of high-beta and low-beta sectors with the S&P500 over a 25 year period.


As you can see, the commonly held theory that you can do no better than the market without taking on more risk is flawed. In the long haul, it is possible to generate superior returns by investing in low volatility or low beta (ie. low risk) sectors. This applies to stock investing too as it is possible to find low-beta stocks which can also generate nice earnings growth and hence stock price appreciation.

This revelation will present a viable sector investing strategy for those more passive, longer-term investors who may not be inclined or ready to take advantage of opportunities arising from the rhythm and flow brought about by shorter-term sector rotation.

Sunday, 1 July 2012

Sector Rotation : Where the smart money flows - Part 1


Hi everyone, welcome back!

In the previous postings, we have made detailed observations and studies into the secular market cycles over the past century. This is important to successful investing because cyclical changes in market conditions often have a critical impact on assets allocation decisions and investing strategies and outcomes.

Successful investing requires understanding the movement of money and funds across asset classes, markets and critically, across sectors in the equity market (our focus today). Money flows from one sector to the next as price changes reflect varying degrees of growth and risk premiums in response to anticipated changes in macro conditions. Growth can relate to prospects of the companies or the economies while risk can relate to crisis unfolding in the industry, the companies themselves or the macro-economic and geopolitical uncertainties. In short, market prices will continuously seek to price in anticipated growth opportunities and risks.

As these trends are driven by some underlying fundamentals rather than technical considerations, they can last from months to even years. Hence sectors which are over-bought (over-sold) can remain over-bought (over-sold)for a long time.

In this posting, I will share with readers specifically the concept of Sector Rotation. To appreciate its importance, one only has to recognise that 50% of a stock's price movement can be attributed to its sector's price movement. If a sector is in favour (money pouring in), even mediocre stocks in this sector will perform well. As a rising tide lifts all boats. Conversely, if a sector is falling out of favour (money flowing out), even the best stocks in this sector will be hard pressed holding up their prices.

As different economic sectors are stronger at different points in the economic cycle, money will anticipate this and flow into different sectors at various points in time. Below is a Sector Rotation Model explaining which sectors may benefit at various points in the economic cycle. Note that the financial markets will always lead the physical economy by at least 6 months as investors collectively anticipate future developments. That is why you see stock markets bottoming out and rebounding when the physical economy may still be deep in recession and where maximum pessimism often prevails.

Source: Sam Stovall's S&P's guide to sector rotation.

The economy and stock market cycles go through four phases.

1. Economy in full recession. Stock Market often bottoms out.

In this phase, economy is contracting, Fed cuts rates, consumer expectations bottoming and yield curve steepening.

Best performing sectors are: Basic Materials, Technology, Industrials and Finance

2. Economy in early recovery. Stock Market is in a bull run.

In this phase, economy starts to expand (moving out of recession), consumer spending rising, industrial production growing, yield curve turned upward sloping.

Best performing sectors are: Industrials (peaking near beginning of this phase), Technology (peaking near beginning of this phase), Consumer Discretionary, Energy (beginning near end of this phase)

3. Economy in full recovery. Stock Market topping.

In this phase, as economy expands strongly, Fed raising rates to fight near-term inflation, yield curve flattening, consumer expectations beginning to decline, industrial production flattening or declining.

Best performing sectors are: Energy (peaking near the beginning of this phase), Consumer Staples (beginning near the end of this phase), Health Care (beginning near the end of this phase)

4. Economy in early recession. Stock Market in a bear run.

In this phase, waning GDP growth, consumer expectations in the pits, industrial production declining, intrest rates are high and peaking, yield curve is flat or inverted as uncertainties about the future impact on long-term corporate borrowing and investments.

Historically profitable sectors are: Health care, Consumer staples, Utilities.

Below is the actual performance of the best and worst performing sectors since 1999. As you can see, pursuing a sector strategy can proof very profitable. The best performing sectors out-perform the S&P500 by an average of 25% while worst performing sectors under-perform the S&P500 by an average of 15.5%.


By identifying the strong sectors and buying the best stocks in only those sectors while avoiding stocks from out-of-favour sectors, you will have given yourself a critical edge with improved odds of successful investing. What is encouraging to note is one can out-perform the market without necessarily taking on excessive risks by being invested in these strong trending sectors or the best stocks found there.

In the next few postings, I will talk about how sector investing is more effective than international investing to achieve diversification benefits and by studying sector volatilities, to suggest a low-risk investing strategy that can still generate superior returns riding on sector momentum.

I will then share with you ways to identify strong trending sectors as money move into these sectors, which always will last for months or years, giving the investors adequate time to respond and take advantage of these opportunities.

Stay tuned in two weeks' time!